Dispersión de plumas de contaminación atmosférica por incendios forestales: un caso de estudio en el sur de Argentina
Forest wildfire air pollution plume dispersion: A case study in Southern Argentina
Agustin Besteiro 
Instituto de Tecnologías Emergentes y Ciencias Aplicadas (UNSAM-CONICET), Centro de Matemática Aplicada, Escuela de Ciencia y Tecnología, Universidad Nacional de General San Martín, 25 de mayo y Francia, San Martín, B1650, Buenos Aires, Argentina. Centro de Altos Estudios en Tecnología Informática, Universidad Abierta Interamericana, Montes de Oca 745 (C1270AAH), Buenos Aires, Argentina.
Rosa Piotrkowski
Instituto de Tecnologías Emergentes y Ciencias Aplicadas (UNSAM-CONICET), Centro de Matemática Aplicada, Escuela de Ciencia y Tecnología, Universidad Nacional de General San Martín, 25 de mayo y Francia, San Martín, B1650, Buenos Aires, Argentina. Facultad de Ingeniería, Universidad de Buenos Aires, Av. Paseo Colón 850, Ciudad Autónoma de Buenos Aires, C1063ACV, Argentina.
DOI https://doi.org/10.59471/raia2026235
Enviado: 01/04/2026. Aceptado: 01/06/2026. Publicado: octubre 2026
Como citar: Besteiro, A. & Piotrkowski, R. (2026). Dispersión de plumas de contaminación atmosférica por incendios forestales: un caso de estudio en el sur de Argentina, 10(1). https://doi.org/10.59471/raia2026235
Resumen
Los incendios forestales representan una amenaza significativa para los ecosistemas, la biodiversidad y la salud humana, lo que resalta la importancia de realizar un seguimiento y una evaluación precisa de su impacto. En este trabajo se utilizan simulaciones con HYSPLIT e imágenes satelitales de MODIS de la NASA para estimar fuentes y niveles de contaminación asociados al incendio forestal iniciado en enero de 2024 en el Parque Nacional Los Alerces, provincia de Chubut, Argentina. A partir de simulaciones y datos observados, se estimó una biomasa de 650 Mg/ha, valor consistente con estimaciones reportadas en la literatura. Además, se estimó la distribución y concentración de material particulado en las áreas afectadas, identificando niveles de contaminación superiores a 100 µg/m³ en zonas cercanas. El estudio combina modelado computacional, datos satelitales y análisis ambiental, y busca contribuir a la evaluación del impacto ecológico y sanitario de los incendios forestales en ecosistemas sensibles.
Palabras claves: Incendios forestales, estimación de fuente, contaminación atmosférica, dispersión atmosférica, HYSPLIT.
Abstract
Forest fires pose significant threats to ecosystems, biodiversity, and human health, highlighting the importance of accurate tracking and assessment of their impact. The sources and levels of wildfire contamination were determined using HYSPLIT simulations and NASA MODIS satellite imagery. The forest fire that started in January 2024 in Los Alerces National Park, located in Chubut Province, Argentina, is presented as a case study. By adjusting the simulation with observed data, the biomass was estimated to be 650 Mg/ha, a value
consistent with estimates reported in the literature. The distribution and concentration of airborne
particulate matter in the affected areas were estimated. Thus, this study assessed
contamination levels in nearby areas, revealing significant air quality impacts, with pollution levels exceeding 100 µg/m³. This research adopts a multidisciplinary approach to deepen our understanding of the ecological and human health impacts of forest fires in sensitive
ecosystems, with the goal of contributing to more effective conservation strategies and enabling future prevention and mitigation efforts.
Keywords: Forest fire, Source estimation, Air pollution, Atmospheric Dispersion, HYSPLIT.
Introducción
Forest fires pose significant threats to ecosystems, biodiversity, and human health, highlighting the importance of accurate tracking and assessment of their impact. The frequency and intensity of forest fires worldwide can be linked to shifts in climate patterns, including prolonged periods of drought and increased temperatures (Jones et al., 2022). However, emissions vary widely due to differences in fuel types, burning conditions, and other environmental factors. The destruction of wildlife habitats and an increase in air, water, and soil pollution can pose significant risks to communities living both in the proximity to fire and in adjacent areas (U.S. Environmental Protection Agency, 2009; Keywood et al., 2015). Thus, it is important to recognize that wildfire impacts can extend well beyond the immediate area of the blaze.
Wildfires emit a combination of gaseous compounds, including carbon monoxide, nitrogen oxides, organic compounds, and particulate matter (PM) into the atmosphere. Specifically, fine particulate matter (PM2.5), from natural and anthropogenic sources, has been linked to various health effects, including respiratory diseases, cardiovascular disorders, neurological impairments, altered behaviors and increased mortality (Grant & Runkle, 2022; Kurtz et al., 2024; Orona et al., 2020; Tesone et al., 2018). Elevated levels of gases and PM released during wildfires can have enduring effects on human health and the environment (Reisen et al., 2015). It was estimated that approximately 340,000 annual deaths can be associated with landscape fire smoke worldwide (Johnston et al., 2012). Recent studies suggest that wildfire-PM is more toxic than equal doses of urban-PM (Aguilera et al., 2021; Franzi et al., 2011).
In 2022, according to the Copernicus Atmosphere Monitoring Service (CAMS), the South American wildfire season had the highest estimated emissions in the last 20 years (Copernicus Atmosphere Monitoring Service, 2022). Los Alerces National Park (LANP), located in Chubut Province, Argentina, is a UNESCO World Heritage Site (UNESCO World Heritage Centre, 2017) renowned for its exceptional natural beauty and biodiversity, including the iconic alerce forests. Covering an area of 263,000 hectares, the park serves as a vital sanctuary for diverse flora and fauna within the Patagonian Forest and Andean highlands ecosystem. Recent events have highlighted the susceptibility of LANP to forest fires, as demonstrated by the outbreak of a fire in the Bahía Rosales area of Lake Futalaufquen. Fueled by adverse weather conditions characterized by low humidity, extreme heat, and strong winds, the fire rapidly spread across the landscape, consuming thousands of hectares of wilderness.
Understanding the dispersion of pollutants from wildfires is crucial for assessing their long-term impact, particularly on air quality. In this context, there is an urgent need for comprehensive strategies to mitigate the impacts of wildfires on forest ecosystems and communities (McKenzie et al., 2004). Therefore, accurate modeling of pollutant dispersion and long-term air quality monitoring in selected regions are essential for informing public health interventions, guiding land-use planning decisions, and promoting sustainable development strategies, especially in fire-prone areas.
Although several dispersion models such as AERMOD (Brode, 2006) and the Community Multiscale Air Quality Modeling System (CMAQ) (U.S. Environmental Protection Agency, 2024), exist, we selected the Hybrid Single-Particle Lagrangian Integrated Trajectory (HYSPLIT) model for its precision and efficiency in simulating atmospheric pollutant dispersion and deposition across different temporal and spatial scales (NOAA Air Resources Laboratory, 2024). This robust and well-known modeling technique has been employed in various contexts, such as volcanic eruptions (Troparevsky et al., 2022), radiation-related incidents (Rolph et al., 2014), city air pollution (Li et al., 2017), airborne desert dust transport (Alebić-Juretić et al., 2024) and for wildfire dispersion (Souto-Oliveira et al., 2023). It is essential to emphasize that accurately estimating the source of fires, often characterized by multiple points of origin, is critical for comprehending various aspects, including the extent of biomass burned and how fire behavior varies based on the materials consumed. Our group has previously employed HYSPLIT to estimate the concentration, transport, and dispersion of airborne particles emitted after the wetland fire of Parque Nacional “Ciervo de Los Pantanos” in Buenos Aires, which lasted 4 days from August 18th to 21st in 2022 (Besteiro et al., 2024).
The aim of this work is to utilize the HYSPLIT model to estimate the multiple points of origin and simulate the dispersion of air pollution contaminants resulting from the forest fire that occurred in LANP last January 2024. Our goal is to offer detailed insights into the spatial distribution and concentration of pollutants by incorporating NASA Moderate Resolution Imaging Spectroradiometer (MODIS) satellite imagery (Justice et al., 2002). We compared MODIS images with simulations from the HYSPLIT model to analyze pollutant extent and movement across the affected region with a finer spatial resolution. This approach enhances the understanding of how atmospheric conditions and topography interact to influence the dispersion patterns of pollutants from the forest fire.
Materials and Methods
Los Alerces National Park Wildfire Scenario
Los Alerces National Park (LANP) is a UNESCO World Heritage Site located in the Chubut province of Argentina covering over 263,000 hectares (lat. 42°48′27″ S, long. 71°53′56″ W) (Figure 1). LANP was established primarily for the conservation of the Patagonian cypress and alerce forests, which are among the oldest trees on the planet. In this area, winters are rainy and snowy, while summers are dry with cool nights. LANP boasts a complex network of lakes (Futalaufquen, Verde, Krüger, Rivadavia, Menéndez, and Amutui Quimei), rivers (Arrayanes River), streams and wetlands, supporting a wide array of flora and fauna.
The wildfire ignited on January 26th and persisted for approximately 2 weeks; it broke out in the Bahía Rosales area of Lake Futalaufquen within LANP. The fire progression was fueled by the park’s dense vegetation, the terrain’s morphology and unfavorable weather conditions, including low humidity, extreme heat, and strong winds. Within a few days, it exceeded the 5,000-hectare mark (El Chubut, 2024). As the fire spread beyond the park boundaries into the surrounding Chubut province, the resulting smoke significantly impacted the population.
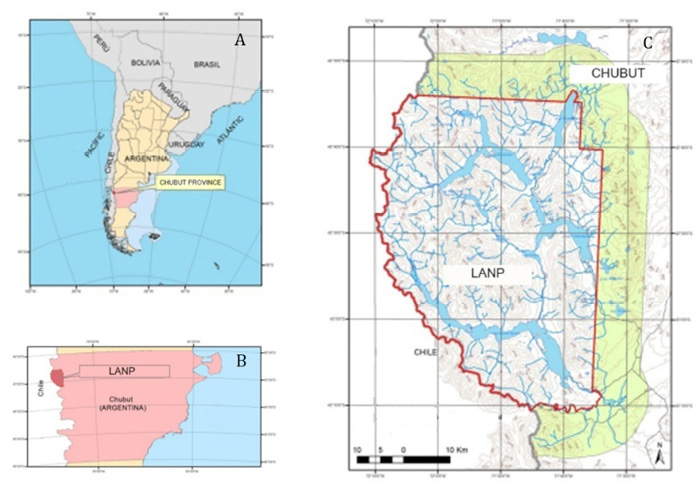
Figure 1: Map of Los Alerces National Park (LANP) A: Argentina showing Chubut Province in light red (Lat. 42°S-46°S, Long. 65°- 71°W). B: LANP (lat. 42° 48′ 27′′ S, long. 71° 53′ 56′′ W), in dark red situated in the northwest of Chubut Province. C: The area outlined in red represents the LANP boundary with the buffer zone in light green (adapted from Pérez A. et al., (2016)).
HYSPLIT Dispersion Model
The HYSPLIT software, developed by the National Oceanic and Atmospheric Administration (NOAA), is a robust modeling tool designed to simulate the transport and transformation of atmospheric contaminants which followed previous pioneering works (Draxler & Hess, 1997). By integrating meteorological data from different sources, HYSPLIT calculates the movement, concentration, and deposition of pollutants across diverse spatial and temporal scales. The model utilizes both Eulerian and Lagrangian methods to simulate pollutant transport dynamics. Euler’s method entails solving equations governing atmospheric flow within discrete spatial and temporal grids, while the Lagrangian approach tracks virtual particles representing pollutants. This combined methodology enables HYSPLIT to accurately predict the dispersion of contaminants from different sources, specifically from a fire source. It is worth noting that the efficacy of HYSPLIT has been validated for modeling air pollution in various scenarios (Choi et al., 2020).
The system of equations (1) forms the basis for determining particle concentration,
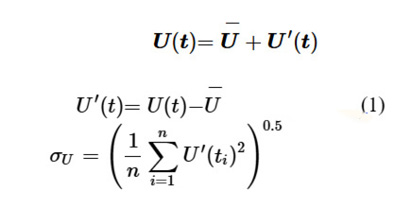
where U(t) represents the wind velocity at a specific time, Ū is the temporal mean of the wind velocity and σU is the standard deviation of the wind velocity. The 3D calculation of particle concentration is composed of two key steps. The first step involves advection, where the trajectory of particles is calculated using the mean wind field obtained from the input meteorological data file. This advection step essentially determines the movement of particles through the atmosphere over time. Equation (2), incorporates the effects of turbulence to refine the particle positions. Turbulent winds introduce fluctuations in the airflow, adjusting the position of particles to their mean trajectory.

In (3) the horizontal turbulent velocity components at the current time U’ (t + Δt) are computed from the turbulent velocity components at the previous time U’(t), introducing an auto-correlation coefficient (R) that depends on the time step, the Lagrangian time scale TLi, and a computer-generated random component (U’’). An exponential velocity auto-correlation is assumed.
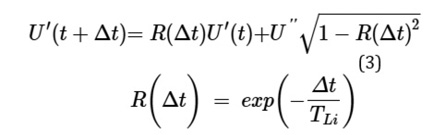
Equations (1)-(3) constitute the framework for the model, derived from the integral model developed by (Draxler & Hess, 1997).
Meteorological and Validating Data
Meteorological data from the NOAA website’s Global Data Assimilation System (GDAS) were utilized for this study. The GDAS dataset includes crucial information such as wind speed, direction, temperature, humidity, and atmospheric pressure, collected at different spatial and temporal scales (Stunder, 2004). The quality and resolution of GDAS data play a crucial role in ensuring accurate trajectory simulations, making it a preferred dataset for studies using the HYSPLIT model (Su et al., 2015).
Geographic data of the LANP area were employed to retrieve meteorological data with a spatial accuracy of 1 degree. Additionally, satellite imagery from the MODIS and National Polar-Orbiting Partnership (Suomi-NPP) Visible Infrared Imaging Radiometer Suite (VIIRS) (Cao et al., 2013) sensors provided valuable information for comparing and validating the wildfire simulation results. All data were collected from January 26th to January 30th.
Pollutant Source Location
The simulation using the HYSPLIT model focused on predicting the spread of pollutants from the wildfire site over several days. While the actual wildfire spanned from January 26th to February 21st , 2024 encompassing the burning of approximately 6,900 hectares (El Chubut, 2024), the simulation was conducted for a duration of 5 days (January 26th to January 30th), for the first 12 hours of each day. These initial 5 days were deemed critical as they captured the most intense phase of the wildfire’s progression, providing valuable insights into the early stages of pollutant dispersion and its potential impact on the surrounding environment.
The exact location of the wildfire incident was determined using satellite imagery and fire detection algorithms provided by NASA’s Fire Information for Resource Management System (FIRMS) (Davies et al., 2019). This precise geolocation data enabled accurate modeling of the wildfire’s spread and dispersion patterns, enhancing the reliability of the simulation results.
Data extracted from FIRMS provides the location of the wildfire, with approximate
coordinates 42°48′11′′ S Lat. and 71°36′32′′ W Long. (Figure 2). These coordinates denote the general area where the wildfire originated and developed after 5 days. As shown in Figure 2, red areas represent thermal anomalies detected using infrared sensors which generally indicate the presence of fires or extreme heat.
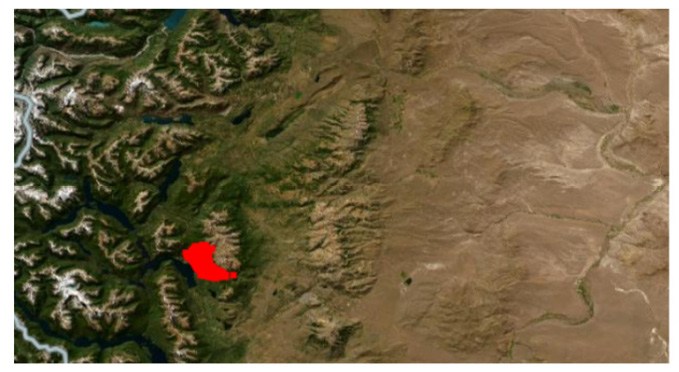
Figure 2: FIRMS image for the first 5 days of the LANP fire. Red areas represent cumulative thermal anomalies detected using infrared sensors during the first 5 days.
Pollutant Source Estimation
For source estimation (tons/hectare), different elements were considered, such as forest density, mean tree height, and the fraction of forest effectively burned. For density calculations we considered the study on wood volumetric density to assess forest biomass in Brazilian Amazonia (Fearnside, 1997); the estimations integrating tree height into pantropical forest biomass estimates (Feldpausch et al., 2012) and a high-resolution canopy height model of the Earth (Lang et al., 2023). From these sources, we considered a wood density of 0.69 g/cm³ and assumed an average tree height of 10 meters in that region from which we obtain an areal biomass density of 69,000 tons per hectare. Additionally, it is known that approximately 1,000 hectares were affected in LANP over the first 5 days (Infobae, 2024).
If the whole forest were burned up this would imply a highly overestimated initial
condition of 575,000 tons per hour as input for the HYSPLIT model. As a result, it would
produce an excessive pollution concentration, measured in micrograms per cubic meter (µg/m³). To obtain concentration levels consistent with reported wildfire pollution values, we considered an effective emitted fraction of 1% of the total estimated biomass. This
concentration level is in line with the observed pollutant levels during forest fires in Uttarakhand, India, reported by Singh (2016), which reached up to 400 µg/m³. Wind, humidity, and the fact that only a percentage of the trees are burned are the potential physical reasons for this adjustment. Furthermore, these estimations not only provided hourly emission rates but also yielded an evaluation of biomass in Megagrams per hectare (Mg/ha).
From our calculations, with the proposed initial condition, we obtain a biomass of 650 Mg/ha. We can compare our results with other estimations obtained when different
methodologies were used. As reported by Blundo et al. (2021), a 300 to 500 Mg/ha was estimated for the northwestern Argentine zone. Furthermore, a study that focuses on fire emissions in Patagonia, particularly in Andean cypress forests (Defossé et al., 2020),
obtained estimates of biomass between 300 and 450 Mg/ha for Trevelin, Cerro Centinela, and La Colisión sites. Additionally, Bertolin et al. (2015) provided relevant biomass estimations for the Lago Guacho, La Torta, and La Colisión sites in the Patagonian zone obtaining 565, 543, and 631 Mg/ha, respectively. Thus, our estimation of 650 Mg/ha suggests that our approach aligns with the findings of these previous studies.
Taking this information into account, we considered an emission rate of 5,750 tons per hour, with the initial release lasting for 120 hours. After running the simulation, the
concentration of wildfire pollutants was analyzed. Results were obtained in µg/m³, providing insights into the spatial distribution and intensity of pollutant dispersion.
Results and Discussion
HYSPLIT Simulation and Satellite Image Comparison
We conducted a series of HYSPLIT simulations for the wildfire incident at LANP spanning 5 days, from January 26th to January 30th , 2024 in conjunction with MODIS satellite imagery. These simulations illustrate pollutant levels using color gradients, providing insight into the extent of contamination. While MODIS imagery typically shows a broad grey plume, HYSPLIT simulations offer a more detailed depiction of the actual dispersion pattern, revealing the true extent of pollution (Figure 3).
The left panels of Figure 3 show the simulated wildfire, where contamination levels exceeding 100 µg/m³ are depicted in yellow, particularly in areas near the wildfire source. The circles centered at the source with radii of 20 kilometers illustrate the extent of contamination, highlighting areas potentially affected by the wildfire’s emissions. We compared HYSPLIT outputs with MODIS images (Figure 3 - right panels), where the plume appears much thinner than the width of the area marked in the HYSPLIT simulation.
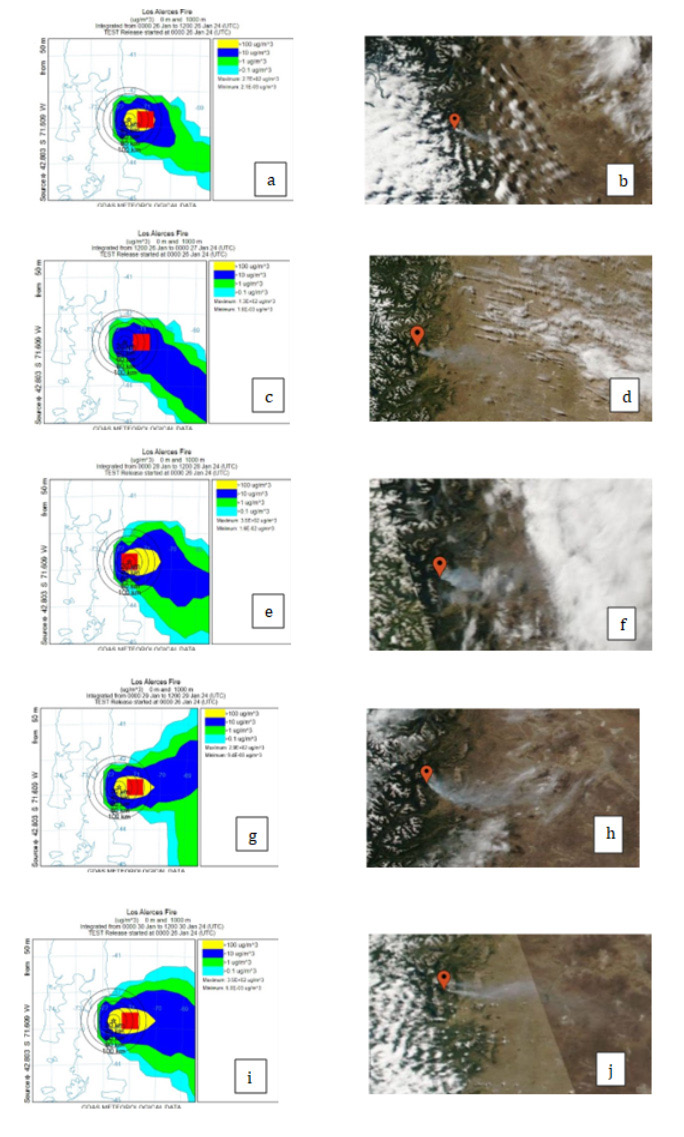
Figure 3: HYSPLIT simulations (left panels) and MODIS images (right panels) from January 26th to January 30th. Pollutant levels exceeding 100 µg/m³ are shown in the yellow areas. Pollutant concentration gradually
decreases with distance from the primary source as shown in the blue, green and cyan areas.
Pollution in Nearby Towns
We selected five towns near Los Alerces National Park as representative examples to evaluate the extent of pollution dispersion from the wildfire: Esquel, Cholila, Trevelin, Corcovado, and Tecka (Figure 4).
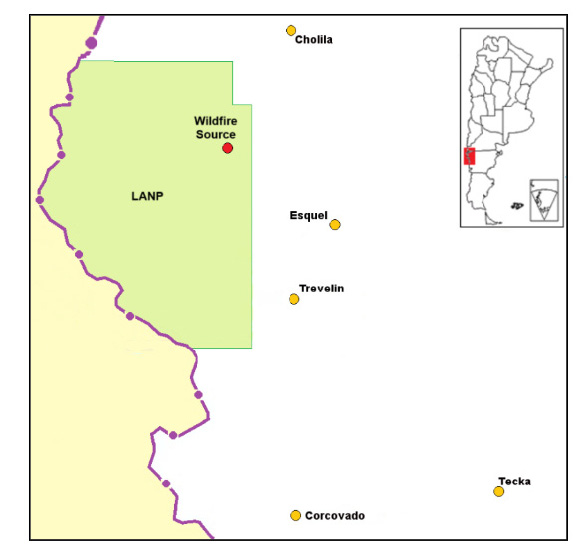
Figure 4: Map of the vicinity of Los Alerces National Park (LANP) in Chubut, showing yellow points for the nearby towns (Cholila, Esquel, Trevelin, Corcovado, and Tecka), a red point indicating the wildfire source within LANP, the park area highlighted in green, and the national border outlined in violet.
Contamination levels for the initial day of the wildfire are shown in Table 1. The data highlights the significant impact of the wildfire on air quality, with contamination levels exceeding 100 µg/m³ in Esquel and Cholila, which are relatively closer to the wildfire source. Even towns farther away, such as Corcovado or Tecka, experienced detectable levels of contamination, albeit at lower concentrations.
|
Town |
Population |
Distance to Source (Km) |
Pollution Level (µg/m³) |
|---|---|---|---|
|
Esquel |
32,758 |
25 |
>100 |
|
Cholila |
2,228 |
35 |
>100 |
|
Trevelin |
7,908 |
30 |
>10 |
|
Corcovado |
1,820 |
80 |
>0.1 |
|
Tecka |
1,237 |
100 |
>1 |
Table 1: Pollution level for each town. Population is extracted from the General Directorate of Statistics and Censuses (Dirección General de Estadística y Censos, 2009).
The contamination levels in five towns over a five-day period, from January 26th to January 30th , are shown in Figure 5. It is evident that the closest towns to the pollution source, Esquel, Cholila and Trevelin, experienced significantly higher contamination levels, while towns, Corcovado and Tecka, located farther away registered lower but measurable levels of contamination.
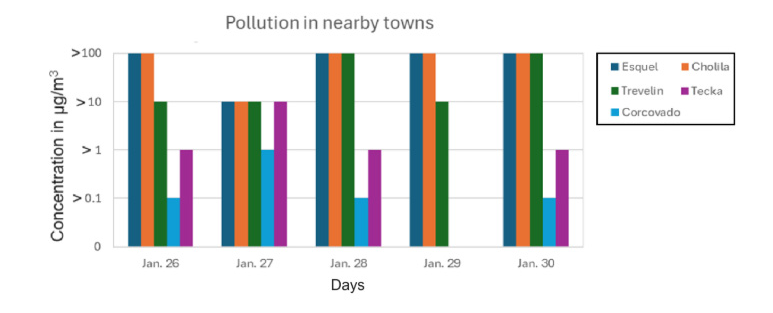
Figure 5: Pollution levels (µg/m³) in nearby towns from January 26th to January 30th.
Table 2 compares the areas with pollution levels exceeding 100 µg/m³ as determined by HYSPLIT simulations to the plume areas observed in MODIS satellite images over a period of five consecutive days. There is a significant difference in the size of these areas throughout the analyzed period. For instance, on January 26th , the HYSPLIT simulation area reached 7,600 km², while the MODIS plume area was 370 km², representing 4% of the simulation area. By January 30th , the HYSPLIT area peaked at 10,500 km², with the MODIS plume area at 1,219 km², accounting for 11% of the simulation area. These figures reflect fluctuations in the intensity and extent of pollution in the region during this timeframe. Generally, the areas identified by HYSPLIT with particle concentrations over 100 µg/m³ are larger than the plume areas detected by MODIS. This difference occurs because MODIS and HYSPLIT provide related but distinct information. MODIS plumes indicate regions with the highest particle density, while HYSPLIT simulations cover broader areas, including regions with lower but still significant concentration levels. The percentage comparison of the MODIS plume area to the HYSPLIT simulation area provides a measure of the correlation between the observed plume areas and the simulated density distribution.
|
Date |
HYSPLIT Yellow Simulation Area (km2) |
MODIS Plume Area (km2) |
Plume/Simulation (%) |
|---|---|---|---|
|
Jan. 26 |
7,600 |
370 |
4 |
|
Jan. 27 |
- |
1,351 |
- |
|
Jan. 28 |
8,400 |
381 |
4 |
|
Jan. 29 |
7,225 |
4,201 |
58 |
|
Jan. 30 |
10,500 |
1,219 |
11 |
Table 2: Yellow area in the HYSPLIT simulation, plume area in MODIS images and the ratio plume/simulation areas. No HYSPLIT area above 100 µg/m³ was obtained for the January 27th simulation.
Conclusions
This study employed HYSPLIT software to simulate the dispersion of pollutants resulting from a wildfire incident in LANP. By utilizing meteorological data and emission estimates, the simulation provided valuable insights into the spread and impact of wildfire emissions on surrounding areas.
We focused on three main objectives. First, we estimated the amount of burned biomass using the simulation outputs. Second, we conducted a qualitative comparison between the HYSPLIT simulation and satellite imagery. Third, we quantitatively studied the impact and expansion of pollutants in areas adjacent to LANP.
The findings highlight the critical importance of monitoring and mitigating the environmental and health impacts of wildfires, particularly in regions with vulnerable populations and ecosystems. The data obtained from the simulation can inform emergency response efforts, facilitating the implementation of targeted measures to protect communities and mitigate the spread of pollutants.
This study emphasizes the need for proactive wildfire management strategies and ongoing surveillance to safeguard the health and well-being of communities near forests all over the world. By incorporating advanced modeling techniques and real-time data analysis, authorities could better anticipate and respond to wildfire events, reducing the risk of adverse impacts on both human health and the environment.
Through a multidisciplinary approach, this research endeavors to enhance our understanding of the ecological and human health implications of forest fires in sensitive ecosystems, ultimately contributing to more effective conservation strategies and disaster preparedness measures.
Funding declaration
This work received funding support from the National Agency for the Promotion of Science and Technology, grants numbers PICT 2021-I-A-00598 and PICTO-2021-UNGS-00001.
References
Aguilera, R., Corringham, T., Gershunov, A., & Benmarhnia, T. (2021). Wildfire smoke impacts respiratory health more than fine particles from other sources: Observational evidence from Southern California. Nature Communications, 12(1), 1493. https://doi.org/10.1038/s41467-021-21708-0
Alebić-Juretić, A., Mifka, B., & Kuzmić, J. (2024). Airborne desert dust in the Northern Adriatic area (Croatia): Different sources. Science of the Total Environment, 912, 169320. https://doi.org/10.1016/j.scitotenv.2023.169320
Bertolin, M. L., Urretavizcaya, M. F., & Defossé, G. E. (2015). Fire emissions and carbon uptake in severely burned lenga beech (Nothofagus pumilio) forests of Patagonia, Argentina. Fire Ecology, 11(1), 32–54. https://doi.org/10.4996/fireecology.1101032
Besteiro, A., Kurtz, M., Masci, I., Bonetto, J., Zitto, M., Piotrkowski, R., & Tasat, D. (2024). Dinámica de plumas en incendios forestales: Simulación y análisis. In Grupo Argentino de Bioestadística, Libro de resúmenes de la XXVII Reunión Científica del Grupo Argentino de Bioestadística (p. 50). Grupo Argentino de Bioestadística. ISBN 978-631-90133-1-3
Blundo, C., Malizia, A., Malizia, L. R., & Lichstein, J. W. (2021). Forest biomass stocks and dynamics across the subtropical Andes. Biotropica, 53(1), 170–178. https://doi.org/10.1111/btp.12858
Brode, R. W. (2006). AERMOD Technical Forum. EPA R/S/L Modelers Workshop, San Diego, CA, United States.
Cao, C., Xiong, J., Blonski, S., Liu, Q., Uprety, S., Shao, X., Bai, Y., & Weng, F. (2013). Suomi NPP VIIRS sensor data record verification, validation, and long-term performance monitoring. Journal of Geophysical Research: Atmospheres, 118(20), 11,664–11,678. https://doi.org/10.1002/2013JD020418
Choi, Y., Kanaya, Y., Park, S.-M., Matsuki, A., Sadanaga, Y., Kim, S.-W., Uno, I., Pan, X., Lee, M., Kim, H., & Jung, D. H. (2020). Regional variability in black carbon and carbon monoxide ratio from long-term observations over East Asia: Assessment of representativeness for black carbon (BC) and carbon monoxide (CO) emission inventories. Atmospheric Chemistry and Physics, 20(1), 83–98. https://doi.org/10.5194/acp-20-83-2020
Copernicus Atmosphere Monitoring Service. (2022, December 12). CAMS: Monitoring extreme wildfire emissions in 2022. https://atmosphere.copernicus.eu/cams-monitoring-extreme-wildfire-emissions-2022
Davies, D., Ederer, G., Olsina, O., Wong, M., Cechini, M., & Boller, R. (2019). NASA’s Fire Information for Resource Management System (FIRMS): Near real-time global fire monitoring using data from MODIS and VIIRS. EARSeL Forest Fires SIG Workshop. https://cnrfire2019.eu/wp-content/uploads/2019/10/Davies_Earsel_2019.pdf
Defossé, G. E., Godoy, M. M., & Bertolin, M. L. (2020). Carbon balance and fire emissions in Andean cypress (Austrocedrus chilensis) forests of Patagonia, Argentina. International Journal of Wildland Fire, 29(8), 661–674. https://doi.org/10.1071/WF19183
Dirección General de Estadística y Censos. (2009). Cantidad de habitantes por localidad. https://web.archive.org/web/20090831211301/ http://www.estadistica.chubut.gov.ar/index.php?option=com_content&task=view&id=19&Itemid=63
Draxler, R. R., & Hess, G. D. (1997). Description of the HYSPLIT4 modeling system. NOAA Technical Memorandum ERL ARL-224. NOAA Air Resources Laboratory. https://repository.library.noaa.gov/view/noaa/31133
El Chubut. (2024, February 6). El fuego arrasó con casi 7000 hectáreas en Los Alerces y está cerca de Esquel. https://www.elchubut.com.ar/chubut/2024-2-6-8-48-0-el-fuego-arraso-con-casi-7000-hectareas-en-los-alerces-y-esta-cerca-de-esquel
Fearnside, P. M. (1997). Wood density for estimating forest biomass in Brazilian Amazonia. Forest Ecology and Management, 90(1), 59–87. https://doi.org/10.1016/S0378-1127(96)03840-6
Feldpausch, T. R., Lloyd, J., Lewis, S. L., Brienen, R. J. W., Gloor, M., Monteagudo Mendoza, A., Lopez-Gonzalez, G., et al. (2012). Tree height integrated into pantropical forest biomass estimates. Biogeosciences, 9(8), 3381–3403. https://doi.org/10.5194/bg-9-3381-2012
Franzi, L. M., Bratt, J. M., Williams, K. M., & Last, J. A. (2011). Why is particulate matter produced by wildfires toxic to lung macrophages? Toxicology and Applied Pharmacology, 257(2), 182–188. https://doi.org/10.1016/j.taap.2011.09.003
Grant, E., & Runkle, J. D. (2022). Long-term health effects of wildfire exposure: A scoping review. The Journal of Climate Change and Health, 6, 100110. https://doi.org/10.1016/j.joclim.2021.100110
Infobae. (2024, January 28). El incendio forestal en el Parque Nacional Los Alerces consumió más de 500 hectáreas y advierten que está fuera de control. https://www.infobae.com/sociedad/2024/01/28/el-incendio-forestal-en-el-parque-nacional-los-alerces-consumio-mas-de-500-hectareas-y-advierten-que-esta-fuera-de-control/
Johnston, F. H., Henderson, S. B., Chen, Y., Randerson, J. T., Marlier, M., DeFries, R. S., Kinney, P., Bowman, D. M. J. S., & Brauer, M. (2012). Estimated global mortality attributable to smoke from landscape fires. Environmental Health Perspectives, 120(5), 695–701. https://pmc.ncbi.nlm.nih.gov/articles/PMC3346787/
Jones, M. W., Abatzoglou, J. T., Veraverbeke, S., Andela, N., Lasslop, G., Forkel, M., Smith, A. J. P., Burton, C., Betts, R. A., van der Werf, G. R., Sitch, S., Canadell, J. G., Santín, C., Kolden, C., Doerr, S. H., & Le Quéré, C. (2022). Global and regional trends and drivers of fire under climate change. Reviews of Geophysics, 60(3), e2020RG000726. https://doi.org/10.1029/2020RG000726
Justice, C. O., Townshend, J. R. G., Vermote, E. F., Masuoka, E., Wolfe, R. E., Saleous, N., Roy, D. P., & Morisette, J. T. (2002). An overview of MODIS Land data processing and product status. Remote Sensing of Environment, 83(1–2), 3–15. https://doi.org/10.1016/S0034-4257(02)00084-6
Keywood, M., Cope, M., Meyer, C. P. M., Iinuma, Y., & Emmerson, K. (2015). When smoke comes to town: The impact of biomass burning smoke on air quality. Atmospheric Environment, 121, 13–21. https://doi.org/10.1016/j.atmosenv.2015.03.050
Kurtz, M., Lezón, C., Masci, I., Boyer, P., Brites, F., Bonetto, J., Bozal, C., Álvarez, L., & Tasat, D. (2024). Air pollution induces morpho-functional, biochemical and biomechanical vascular dysfunction in undernourished rats. Food and Chemical Toxicology, 188, 114777. https://doi.org/10.1016/j.fct.2024.114777
Lang, N., Jetz, W., Schindler, K., & Wegner, J. D. (2023). A high-resolution canopy height model of the Earth. Nature Ecology & Evolution, 7(11), 1778–1789. https://doi.org/10.1038/s41559-023-02206-6
Li, L., Liu, Y., & Wang, Y. (2017). Monitoring an air pollution episode in Shenzhen by combining MODIS satellite images and the HYSPLIT model. IOP Conference Series: Earth and Environmental Science, 74(1), 012010. https://doi.org/10.1088/1755-1315/74/1/012010
McKenzie, D., Gedalof, Z., Peterson, D. L., & Mote, P. (2004). Climatic change, wildfire, and conservation. Conservation Biology, 18(4), 890–902. https://doi.org/10.1111/j.1523-1739.2004.00492.x
NOAA Air Resources Laboratory. (2024). HYSPLIT tutorials. https://www.ready.noaa.gov/HYSPLIT_Tutorials.php
Orona, N. S., Astort, F., Maglione, G. A., Ferraro, S. A., Martin, M., Morales, C., Mandalunis, P. M., Brites, F., & Tasat, D. R. (2020). Hazardous effects of urban air particulate matter acute exposure on lung and extrapulmonary organs in mice. Ecotoxicology and Environmental Safety, 190, 110120. https://doi.org/10.1016/j.ecoenv.2019.110120
Pérez, A., Caracotche, S., Izquierdo, M., Chehebar, C., & Tagliorette, A. (2016). Inscripción Parque Nacional Los Alerces como Sitio del Patrimonio Mundial de UNESCO. https://sib.gob.ar/archivos/sitio_de_Patrimonio.pdf
Reisen, F., Duran, S. M., Flannigan, M., Elliott, C., & Rideout, K. (2015). Wildfire smoke and public health risk. International Journal of Wildland Fire, 24(8), 1029–1044. https://doi.org/10.1071/WF15034
Rolph, G. D., Ngan, F., & Draxler, R. R. (2014). Modeling the fallout from stabilized nuclear clouds using the HYSPLIT atmospheric dispersion model. Journal of Environmental Radioactivity, 136, 41–55. https://doi.org/10.1016/j.jenvrad.2014.05.006
Singh, S. (2016). Implications of forest fires on air quality: A perspective. Bulletin of Environmental and Scientific Research, 5(3–4), 1–4. https://www.researchgate.net/publication/317357743_Implications_of_forest_fires_on_air_quality_-_a_perspective
Souto-Oliveira, C. E., Marques, M. T. A., Nogueira, T., Lopes, F. J. S., Medeiros, J. A. G., Medeiros, I. M. A., Moreira, G. A., da Silva Dias, P. L., Landulfo, E., & Andrade, M. F. (2023). Impact of extreme wildfires from the Brazilian forests and sugarcane burning on the air quality of the biggest megacity in South America. Science of the Total Environment, 888, 163439. https://doi.org/10.1016/j.scitotenv.2023.163439
Stunder, B. (2004). Global Data Assimilation System (GDAS1) archive information. NOAA Air Resources Laboratory. https://www.ready.noaa.gov/gdas1.php
Su, L., Yuan, Z., Fung, J. C. H., & Lau, A. K. H. (2015). A comparison of HYSPLIT backward trajectories generated from two GDAS datasets. Science of the Total Environment, 506–507, 527–537. https://doi.org/10.1016/j.scitotenv.2014.11.072
Tesone, A. I., Vitar, R. M. L., Tau, J., Maglione, G. A., Llesuy, S., Tasat, D. R., & Berra, A. (2018). Volcanic ash from Puyehue-Cordón Caulle Volcanic Complex and Calbuco promote a differential response of pro-inflammatory and oxidative stress mediators on human conjunctival epithelial cells. Environmental Research, 167, 87–97. https://doi.org/10.1016/j.envres.2018.07.013
Troparevsky, M. I., Muszkats, J. P., Seminara, S. A., Zitto, M. E., & Piotrkowski, R. (2022). Modeling particulate pollutants dispersed in the atmosphere using fractional turbulent diffusion. Physica A: Statistical Mechanics and its Applications, 599, 127478. https://doi.org/10.1016/j.physa.2022.127478
UNESCO World Heritage Centre. (2017). Los Alerces National Park. https://whc.unesco.org/en/list/1526/
U.S. Environmental Protection Agency. (2009). Integrated Science Assessment for Particulate Matter (Final Report No. EPA/600/R-08/139F). U.S. Environmental Protection Agency. https://assessments.epa.gov/isa/document/&deid=216546
U.S. Environmental Protection Agency. (2024). CMAQ: The Community Multiscale Air Quality Modeling System. https://www.epa.gov/cmaq